Chapter 13 — Methods and Effects of Government Intervention in Markets
Cambridge International AS & A Level Economics (9708) · Unit 3.2 · 4th edition coursebook
Learning objectives
- Analyse the impact and incidence of specific indirect taxes.
- Analyse the impact and incidence of subsidies.
- Explain direct provision of goods and services.
- Analyse maximum and minimum prices.
- Analyse buffer stock schemes.
- Explain provision of information.
Key terms
- incidence
- The extent to which the tax burden is borne by the producer or the consumer or both.
- maximum price
- A price that is fixed; the market price must not exceed this price; sometimes called a price ceiling.
- minimum price
- A price that is fixed; the market price must not go below this price; sometimes called a price floor.
- buffer stock scheme
- A type of commodity agreement designed to limit price fluctuations.
13.1The impact and incidence of specific indirect taxes
Indirect taxes come in two main forms. Ad valorem taxes are charged as a proportion or percentage of the retail price — VAT and GST are typical examples, with the tax element either included in the published retail price or added at the final transaction stage. Specific taxes are a fixed amount per unit purchased — for example, a fixed tax per litre of fuel.
Indirect taxes are widely used to discourage the production and consumption of demerit goods such as cigarettes and high-sugar drinks. Although the tax is legally imposed on the producer, much of it is typically passed on to consumers through higher prices.
When a specific indirect tax is imposed, the producer needs a higher price than before to make supplying the product worthwhile by the amount of the tax. The supply curve shifts vertically upward (i.e. to the left) by the amount of the tax. Figure 13.2 shows the result: the market price rises from P to P₁, the quantity traded falls from Q to Q₁, and the gap between the new equilibrium price the consumer pays and the lower price the producer effectively receives (P₂) is split into two areas — A, borne by the consumer, and B, borne by the producer.
The incidence of an indirect tax is the term economists use for how the burden is shared. The split depends on the price elasticity of demand and the price elasticity of supply. The more price-inelastic the demand, the more easily the seller can pass the tax onto the consumer in higher prices. This is why heavy indirect taxes typically fall on products with inelastic demand such as fuel and cigarettes. Where demand is elastic, consumers respond to the price rise by buying less, and the producer has to absorb more of the tax. Figure 13.3 illustrates the two cases.
In many low- and lower-middle-income market economies, governments struggle to collect taxes. In particular, direct (income) tax collection is constrained by a narrow tax base — many workers operate informally or are not registered for tax. For that reason, governments in emerging economies often rely more on indirect taxes than on direct taxes.
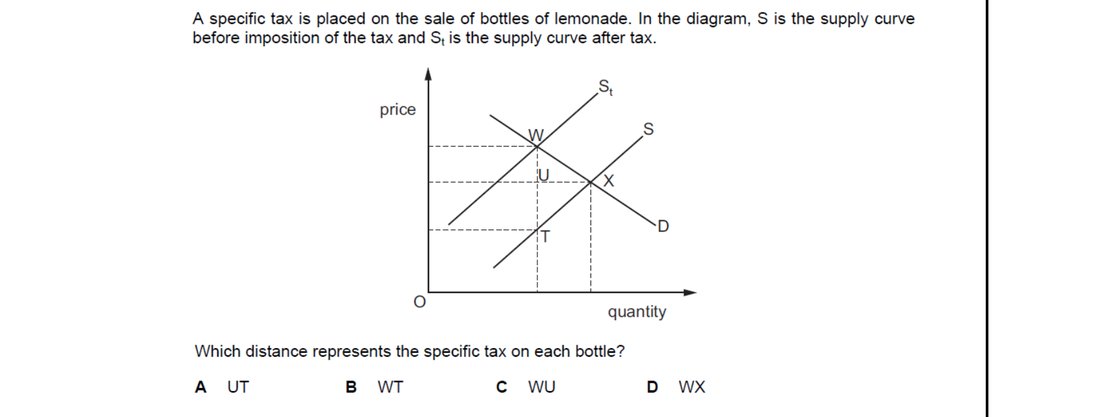
A specific (per-unit) tax shifts the supply curve vertically upward by the exact tax amount. The vertical distance between the original and post-tax supply curves at any quantity therefore measures the tax per bottle. Option B – the gap WT between S and S1 at the post-tax equilibrium quantity – represents the specific tax per unit. The other distances mix price changes and tax incidence.
13.2The impact and incidence of subsidies
A subsidy is a direct payment from the government to producers (or, sometimes, to consumers) of a good or service. Subsidies are used for many reasons: keeping the market prices of essentials down, encouraging consumption of merit goods, contributing to a more equitable distribution of income, providing services the free market would not supply, raising producers' incomes (especially in agriculture), enabling exports, or reducing dependence on imports by supporting close domestic substitutes.
A subsidy paid to a producer has the opposite effect of an indirect tax: it is equivalent to a reduction in the producer's costs, and it shifts the market supply curve to the right. Figure 13.4 shows the result: price falls from P to P₁ and the quantity traded rises from Q to Q₁. A reduction in subsidy payments has the reverse effect, shifting supply to the left.
The incidence of a subsidy — like the incidence of a tax — is shared between consumers and producers. Figure 13.5 shows this: consumers benefit through a lower price (P₁ instead of P), and producers benefit through receiving a price higher than they would have at the new larger quantity supplied on the open market. The exact split depends on the relative elasticities of demand and supply, by the same logic as taxes.
Subsidies are controversial. They distort market signals and they have a clear opportunity cost — the tax revenue used to fund a subsidy could have been spent on something else. They are difficult to size accurately. And because they are typically 'blanket' (lump-sum per unit) payments, they cannot easily be linked to ability to pay: high- and low-income consumers pay the same subsidised price per unit. Assessing who benefits from a particular subsidy is therefore important. Subsidies on staple foods, for example, are paid by all income groups, many of whom can afford to pay more; subsidies on mass transit, on the other hand, are usually targeted (low earners, students, older people) and serve wider goals such as reducing congestion and pollution.
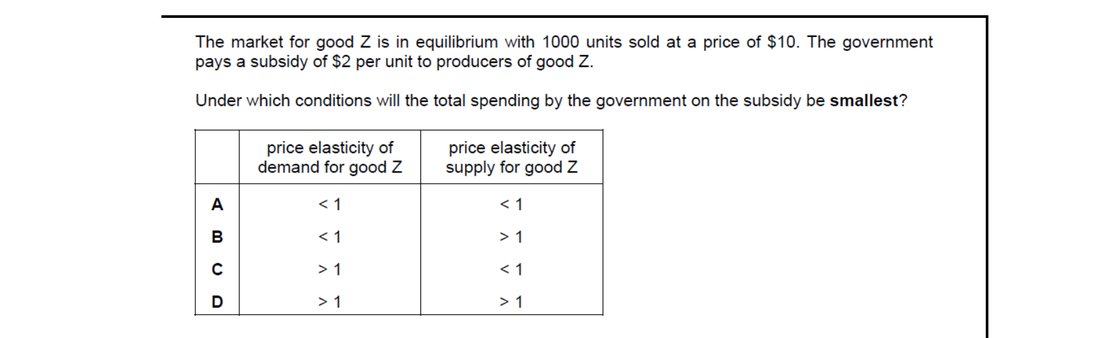
Government spending on a per-unit subsidy = subsidy x equilibrium quantity sold. Spending is smallest when quantity rises least after the subsidy, which happens when both demand and supply are price inelastic – the supply shift moves price down but quantity barely changes. Option A – PED < 1 and PES < 1 – minimises the subsidised quantity and so minimises total cost.
13.3The direct provision of goods and services
Governments can intervene directly by providing certain important goods and services themselves, free of charge at the point of use or consumption. The cost is financed through general taxation. When the same level of service is used roughly equally by all citizens, those on the lowest incomes gain most as a percentage of their income — so direct provision tends to reduce inequality.
The two largest examples of direct provision are merit goods (such as healthcare and education) and public goods (such as defence, fire protection, and street lighting).
For merit goods, the most common pattern is partial free provision, with some elements free at the point of use and others paid for. The healthcare and education markets are subject to various market failures, but the failures alone do not justify free provision; the justification is on grounds of equity — that everyone should have access to a certain level of healthcare and education regardless of income. Where universal free provision is adopted, the service operates as the material equivalent of a universal cash benefit.
For public goods, the case for direct provision is stronger: the market mechanism does not produce them at all, because of the free-rider problem (see Chapter 6). Tax-funded provision is the only realistic option, although a frequent criticism is that direct government supply is less efficient than competitive markets would be.
Direct provision varies markedly across economies. Some high-income countries provide universal free healthcare; others limit free provision to specific groups; many low-income countries provide only basic healthcare free of charge and rely on user fees for the rest. Education provision varies similarly. The choices reflect both economic capacity (tax revenue available) and political values about the appropriate role of the state.
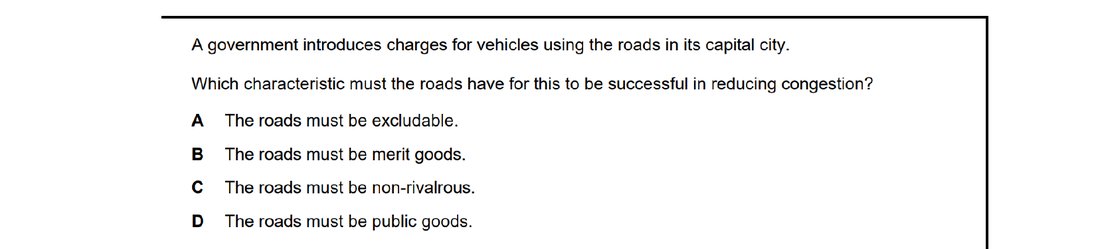
Road pricing reduces congestion only if users who refuse to pay can be excluded from the road. Option A – the roads must be excludable – is the necessary characteristic; otherwise drivers would free-ride and charges could not be collected. Merit-good status (B), non-rivalry (C) and public-good status (D) would all undermine, not enable, a workable charging scheme.
13.4Maximum and minimum prices
Where the free-market price of a good is judged to be too high, the government may impose a maximum price (price ceiling) on that good or service. The motivation is usually to assist low-income households, reduce inequality, or recognise wider social benefits of consumption. Maximum prices are only binding when set below the free-market equilibrium price — otherwise the market would clear at a lower price anyway. Common applications include staple foods (rice, cooking oil), fuel, residential rents, utilities (water, gas, electricity), and transport fares.
Figure 13.7 shows the consequences. At the maximum price P₁ (below equilibrium P), producers are willing to supply only Q₁, but consumers demand Q₂. The gap Q₁ to Q₂ is a shortage. Some consumers — those who can still get the good at the lower price — are better off; others cannot get it at all, because not enough has been produced. The shortage has to be rationed by some non-price mechanism: queuing, formal rationing, lotteries, or informal/underground markets where consumers may pay prices well above the legal maximum.
Key concept link — government, equality and equity
Maximum prices interfere with the unregulated market mechanism largely for reasons of social equity. The prices of essential items are capped to help those who are on low incomes and this goes some way towards a more equal distribution of income. The trade-off is that the free market is distorted and may not bring the full benefits that might be expected.
Minimum price control
A minimum price (price floor) is set above the equilibrium price. Common applications include demerit goods (high-sugar drinks), agricultural products, wages in low-skill occupations (the minimum wage), and certain types of imported goods where close domestic substitutes exist.
Figure 13.9 shows the consequences. At the minimum price P₁ (above equilibrium P), suppliers are willing to supply Q₂ but consumers only demand Q₁. The gap Q₁ to Q₂ is excess supply. The price cannot fall to clear the market, so consumers buy only Q₁ — and producers are left with unsold output (unless the government agrees to buy it, as it often does for agricultural products to support farm incomes).
Minimum prices also blunt the incentive for high-cost producers to improve, because the floor protects them from lower-cost competitors. As with maximum prices, an informal market can develop — particularly for products like cigarettes where the legal price floor is well above what some sellers would charge.
A specific indirect tax shifts the supply curve upward by the tax amount, raising the new equilibrium price and lowering the quantity traded. The incidence (split of the tax between buyers and sellers) depends on relative PED and PES. Option C – higher price, lower quantity – captures this universal result of an effective indirect tax.
13.5Buffer stock schemes
Prices in agricultural markets are particularly unpredictable because supply varies sharply with weather, pests and harvest cycles. A buffer stock scheme is designed to smooth out these price swings by buying and selling stocks of a product depending on market conditions. In essence, a buffer stock scheme combines a minimum price with a maximum price for the same product.
The mechanics are straightforward. The scheme begins by setting a minimum price for, say, potatoes. If the market price would otherwise fall below the minimum, the scheme buys stocks of potatoes from growers and stores them in warehouses. The reduction in supply on the open market pushes the market price back up to (or above) the minimum.
The scheme can also operate a maximum price. If the market price would otherwise rise above the maximum, the scheme releases stored stocks onto the market. The increase in supply pushes the market price back down to (or below) the maximum.
13.6Provision of information
Information failure (Chapter 6) is one of the main causes of underconsumption of merit goods and overconsumption of demerit goods. It therefore makes sense for the government itself to use information provision as a form of intervention. Information-based interventions tend to be cheaper than taxes, subsidies or direct provision, and they leave the consumer's freedom to choose intact while improving the basis on which the choice is made.
Common examples include:
- compulsory information on cigarette packets warning of the dangers of smoking
- public health announcements and campaigns (vaccination, healthy eating, road safety)
- advice on non-prescription medicines
- mandatory nutrition and allergy information on food packaging
The effectiveness of information provision depends on whether consumers actually receive, understand, and act on the information. In practice, evaluating an information campaign in isolation is difficult, because campaigns usually run alongside other policies (taxes, regulation, advertising restrictions) and the combined effect is hard to disentangle.
End-of-chapter practice
Past-paper questions from CIE 9708. Pick A, B, C or D. Answers are saved on this device — press Download report (PDF) at the top to save them.
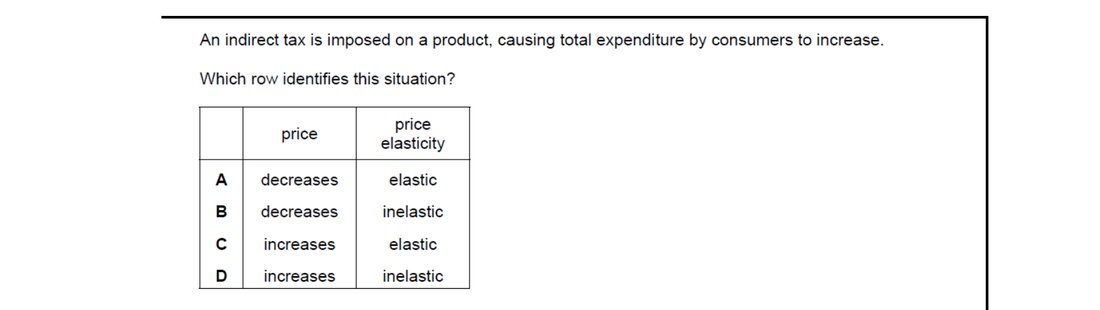
Total consumer expenditure rises after an indirect tax only if the percentage rise in price exceeds the percentage fall in quantity. That happens when demand is price inelastic. Because price rises and quantity falls, the option must combine 'price increases' with 'inelastic demand'. Option D – price increases, inelastic demand – is the correct combination.
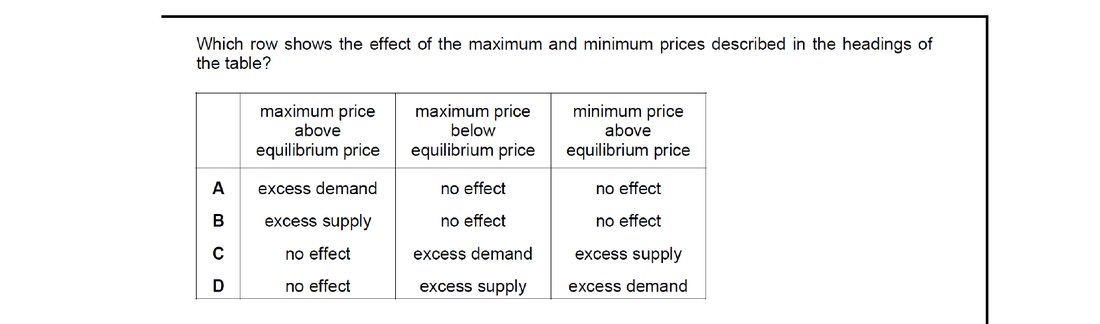
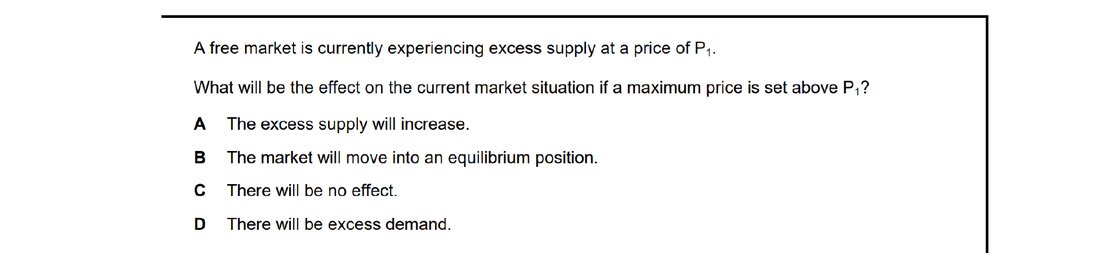
A maximum price binds only when set below equilibrium, producing shortage (excess demand). A minimum price binds only when set above equilibrium, producing surplus (excess supply). Option C captures this: a maximum price above equilibrium has no effect, below it creates excess demand; a minimum above equilibrium creates excess supply.
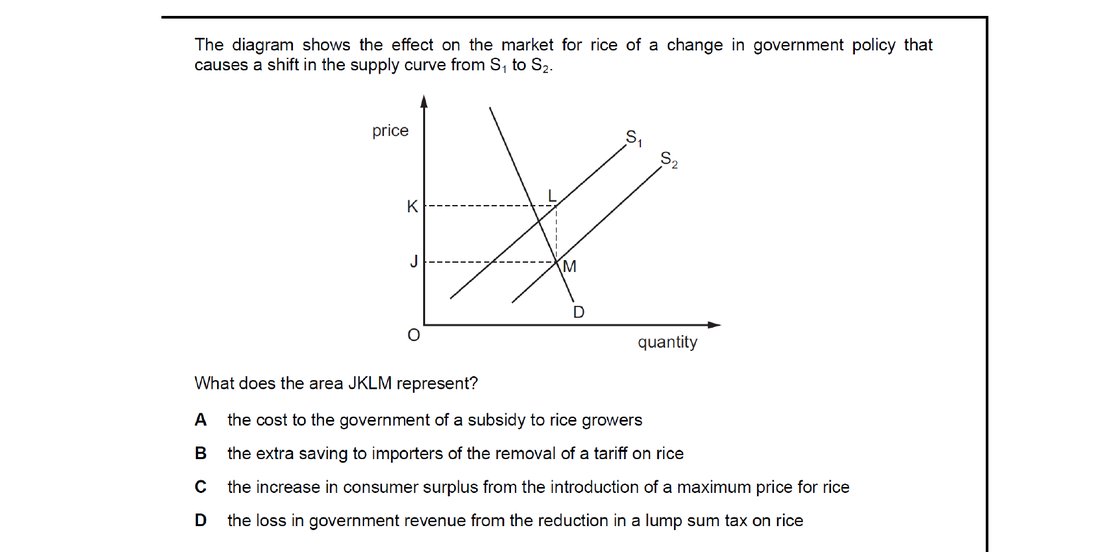
The supply curve shifts left from S1 to S2, raising price and reducing the equilibrium quantity. The rectangle JKLM lies between the two prices over the post-shift quantity – exactly the tax revenue the government would have collected on those units before scrapping it. Option D – the loss of government revenue from removing a lump-sum tax – matches this rectangle.
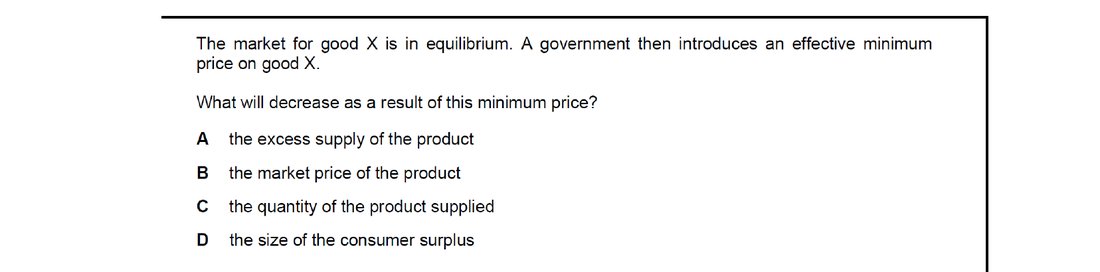
An effective minimum price is set above equilibrium and binds. At the higher price quantity demanded falls and quantity supplied rises, creating excess supply. Consumers buy fewer units at a higher price, so consumer surplus shrinks. Option D – the size of consumer surplus decreases – is the only quantity in the list that falls; supply, excess supply and market price all rise.
An effective maximum price is set below equilibrium. At that price quantity demanded exceeds quantity supplied, creating excess demand – a shortage. Option D – a shortage of foodstuffs – is the direct consequence. The other options misread the policy: A overstates aggregate inflation, B reverses the price effect, and C confuses import effects with shortage.
Consumer surplus losses are largest when buyers cannot easily switch away. With price-inelastic demand consumers absorb most of the tax via higher prices, and with price-elastic supply the supply curve shifts up by a relatively larger amount. Option C – inelastic demand and elastic supply – maximises the burden on consumers and therefore the loss of consumer surplus.
Attempt the practice questions above to build your score.
Self-evaluation checklist
After studying this chapter, you should be able to:
- Analyse how indirect taxes and subsidies affect the demand and supply of products in the market.
- Understand the situations when governments may need to impose maximum and minimum price controls.
- Analyse the importance of buffer stock schemes in smoothing price rises and falls of products.
- Explain when governments may directly intervene in the market by providing information.
Want more practice? Drill this chapter's past-paper MCQs (196 questions) →